Yeah, probably. Look at this dumbo octopus. Also, a tardigrade (an aquatic animal). Not sure how I found this. It is an extremophile, and can survive in space. I thought that was interesting.
Also, about the graphs, mine was a "reconstruction", not the original. The interglacial temperature graph you presented isn't what I'd call visually accurate. It has been made in such as way that is shows a supposedly bigger difference now. If it was edited for the y-axis to start at 0, then you would see quite a difference to that. Also, the top temperature for the Minoan Warming was only around -28.75 degrees Celsius, but the modern one is about -31.5.
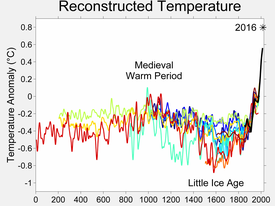
The word reconstruction is used to describe temperature date derived from Proxy data. You graph is the that was created from that data with modern temperatures spliced on the end. based on all the errors that were later documented the graph was remade by many researchers but with all the errors corrected. The graph below showed the medieval warm period was within 0.5C of todays temperature. The little ice age is also more sever than in the graph you linked to
Some researchers are now using giant clams to reconstruct temperature.Giant clams have growth rings and can be carbon dated. And by precisely measuring the ratios of certain elements in the shell they can accurately determine temperature. Same can be done for coral deposits and cave deposits. All this data is showing the same thing. The earths temperature was warmer 5000 years ago than it is today. Also CO2 levels are higher today than they were 5000 years ago. Changing the Y axis on a graph will not change that fact. Something other than CO2 caused temperatures to be warmer back then Also data is showing the medieval,roman, and minoan warm periods were not just in europe. they were world wide.
The amount we mite each years does change slightly from year to year but not by much. What is important to to climate is how much is in the air outside. For the last few years it has been at 400ppm It it was 280ppm 100years ago. so overall we are only adding about 1ppm per year. 5000 years ago the data is telling use CO2 levels were lower than today but temperatures were warmer. Something other than CO2 caused temperatures to be warmer back then. The warming over the last 30 years may have been caused by that same thing. Whatever it was. And there is growing evidence that it was the sun that did it. Not CO2.
The graph below showed the medieval warm period was within 0.5C of todays temperature. The little ice age is also more sever than in the graph you linked to
If it went from the severe little ice age to warmer than the Medieval Warm Period in a short amount of time, doesn't that suggest human caused climate change? If that isn't enough, look at the graph. The temperature starts going up drastically part way through the 1800's, around the time of the industrial revolution. I don't think that's just a coincidence.