Well.... Darn

The April FOTM Contest Poll is open!
FishForums.net Fish of the Month
🏆 Click to vote! 🏆

https://www.thenewamerican.com/tech...news-story-global-warming-and-phony-consensus
The Petition Project features over 31,000 scientists signing the petition stating "There is no convincing scientific evidence that human release of carbon dioxide will, in the forseeable future, cause catastrophic heating of the Earth's atmosphere ...". (Petition Project)


Is it alright if I continue on with your 10 myths post?
where did this go?
 
Note in my earlier posts I wasn't saying that warming isn't happening. What I am saying is that the warming that is occurring is not nearly as bad as being reported. Furthermore just because CO2 levels are going up while the earth is warming doesn't mean CO2 is the caused the warming. In fact all the best data we have at present indicate all the warming seen in the 60 years was caused by changes in the suns solar output.
https://www.amazon.com/Neglected-Su...ar&reviewerType=avp_only_reviews&pageNumber=1

The below graph shows a reconstruction of the controversial hockey stick graph you mentioned. It shows the Medieval Warm Period that you mention, but as you see that was much more gradual, and overall lower, than the modern rise.


View attachment 83676

The "hockey stick graph" was found to be full of errors. The software used generated a hockey stick when it processed random numbers. The Graph was created by Michle Mann He has never left his office to collect his data. He just grabbed the data from an archive in a library and never verified it was good for climate prediction. The person that actually collected the data did not recommend using it for climate research. Also no statistical tests was done to verify the graph matched the data. When it was done it completely failed the tests meaning the graph does not match the data. Read the book on the book below and you will see why it is no longer used win IPCC reports.
https://www.amazon.com/dp/B005A54KEM/?tag=ff0d01-20

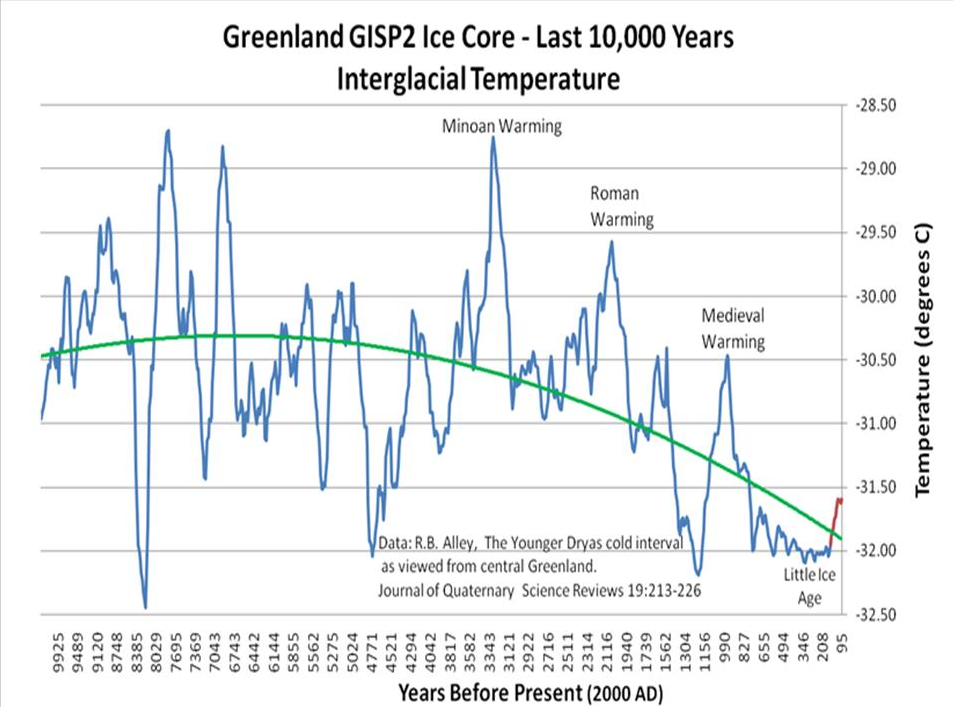
This image shows the best reconstruction we have of temperature for the last 10,000 years. Note the little ice age and medical warm period was a natural warming and cooling cycle that repeats every 1000 years. The minoan warm period was much warmer than the medieval and roman warm periods. And todays temperature have not reached those levels.
Screen_shot_2012-10-06_at_11.14.04_AM.png


So when you see the words unprecedented or record breaking keep in mind they are only referring to at best the last 100 years of decent record keeping. Time has erased much of human history. The best data we have (satellite data) is only 40 years old. Prior to satellites. The Peru stories of referring to El nino were considered to be just stores. Coral bleaching reports were scattered lacked detail and were not scientifically useful. It wasn't until 1980 that we saw the first one. Satellites have seen only 3 large El ninos and several much smaller ones. Since then we have looked through records and found evidence of El nines all throughout human history. Geologist has also found evidence of El nines going back thousands of years. And the big ones appear to only occur every 18 years or so. This 18 year period indicates the moon and the sun are the key players in El ninos. They have 11,18, and 22 year periods. CO2 impact on climate is the same every year. Therefore CO2 doesn't cause El ninos or the coral bleaching El ninos cause.

The graph below shows how satellite data compares to all of the computer models and weather ballon data. You can see that the models don't reflect reality. Many climate forecast of global disaster are based on models. If the models can't get it right then the predictors of global disaster should be viewed as nothing more than guesses.

christymt_gl_102_models.png


Note this year has seen major flooding everywhere on earth. Just about every country or state on earth has had some flooding. This years flooding was predicted in 2007. The scientist didn't use computer models or factor in CO2. they made their prediction based purely on rainfall and solar sunspot data. This is the start of a 30 year cooling period that is also expected to occur (see my link to the Neglected sun earlier).

https://anhonestclimatedebate.files.wordpress.com/2009/02/2982-journal-of-civ-eng-vol-49-no-2.pdf
 
Last edited:
As an Amazon Associate we earn from qualifying purchases.
CO2 impact on climate is the same every year. Therefore CO2 doesn't cause El ninos or the coral bleaching El ninos cause.


christymt_gl_102_models.png
Not really. The amount we are emitting is changing annually, and the amount we are emitting would have some effect. For example, if you took a cup of sea water, which is already salty, and added more salt in, the salinity would rise. If you are suggesting that CO2 has the same effect in different amounts, what do you suggest happens to the excess?

Also, about the graphs, mine was a "reconstruction", not the original. The interglacial temperature graph you presented isn't what I'd call visually accurate. It has been made in such as way that is shows a supposedly bigger difference now. If it was edited for the y-axis to start at 0, then you would see quite a difference to that. Also, the top temperature for the Minoan Warming was only around -28.75 degrees Celsius, but the modern one is about -31.5. Remember, global warming can also lower temperatures in places (which is why it is often referred more accurately to as climate change). Something you might find interesting:
https://insideclimatenews.org/news/...c-means-cold-winters-elsewhere-Boston-US-Asia
 
Never answered my question; AGAIN, how is it hard for them to escape?


Then he would die due to lack of oxygen because the blankets are to thick. depending how many you threw on him.
Assuming you didn't put them on his head, and they were thin. I think it's harder for the heat to escape because it has to go through more (the greenhouse gases), which are trying to keep it in.
 
amount we are emitting
what is that amount? I know im asking a lot of questions but its part of what im writing in my word doc I got for ya.

I think it's harder for the heat to escape because it has to go through more (the greenhouse gases), which are trying to keep it in.
Has to go through more- more what you didn't say?
 
what is that amount? I know im asking a lot of questions but its part of what im writing in my word doc I got for ya.


Has to go through more- more what you didn't say?
I don't have exact figures, but in 2011 alone 38.2 billion tons of carbon dioxide was emitted. For more info, google "amount of CO2 emitted by humans each year".
I think it's harder for the heat to escape because it has to go through more (the greenhouse gases), which are trying to keep it in.
That answers the second part. Make sure to share the doc.
 
CO2 causes traps heat. Here is the general reason why:

Sunlight is caused by certain wavelengths of light from the sun. These wavelengths of light contain energy in the form of heat. This energy is partially absorbed by the earths surface, warming it, and partially reflected by the earths surface as a longer wavelength (the amount absorbed depends on the color of that surface). Some of that energy escapes out into space but some is absorbed by carbon dioxide molecules and reflected back to the earths surface, further warming the surface of the planet.

CO2 spends a great deal of time in the atmosphere (on the scale of years). In comparison, water vapor exits the atmosphere quickly as rainfall or snow.

CO2 also affects the ocean. Some of the CO2 is absorbed by the ocean. That absorbed CO2 causes a chemical reaction with dissolved calcium carbonates in the water. As a result, there are more H+ ions. The H+ causes and overall drop in pH (of about .1 pH units since preindustrial times). In addition, ocean acidification causes a decrease in the calcium carbonate ions corals and other calcifying animals use to build their skeletons. This leads to slower growth rates and a less dense dense coral skeletons.


Sent from my iPhone using Tapatalk
 
was emitted.
Then how much was "eaten" or consumed by plants?

Make sure to share the doc.
Will when its done being written !

That answers the second part.
Now I am, not even kidding, confused about your answer,
I asked:
"How is it hard, for carbon dioxide to escape a greenhouse?"
You answered:
"I think it's harder for the heat to escape because it has to go through more (the greenhouse gases), which are trying to keep it in."
Harder for heat to escape because it has to go through more What ???
 
All I saw was a bunch of quotes that said "yea yea its real guys its there man, believe me dewd its real!"
Im asking what You meant if that's ok.
greenhouses, including mine, have huge fans in them to keep the air at about eighty degrees.
It doesn't get like one hundred and twenty in there, it would fry plants.
 
When was anyone talking about greenhouses, as in the growing ones?
LMAO
I feel dumb now lmoa, I thought that's what you meant the whole time :drinks:
Well let me go back to dr.google now so I can get an answer, let me think out my life now... *sad violin*

ok now im confused to what the question was... or the debate, argument, you know.
...
...
............
.
 

Most reactions

trending

Members online

Back
Top